About This Site
The material on this site was created for an introductory course on educational research. Each of the topics featured here is much more complex than presented here. The purpose of these pages is to introduce beginning researchers to the topics with the expectation that they will further develop their expertise with additional resources.
If you are interested in pursuing an online Master’s in Educational Psychology with an emphasis in Research Methods, Measurement, and Evaluation at UConn, you can find more information on their website.
|
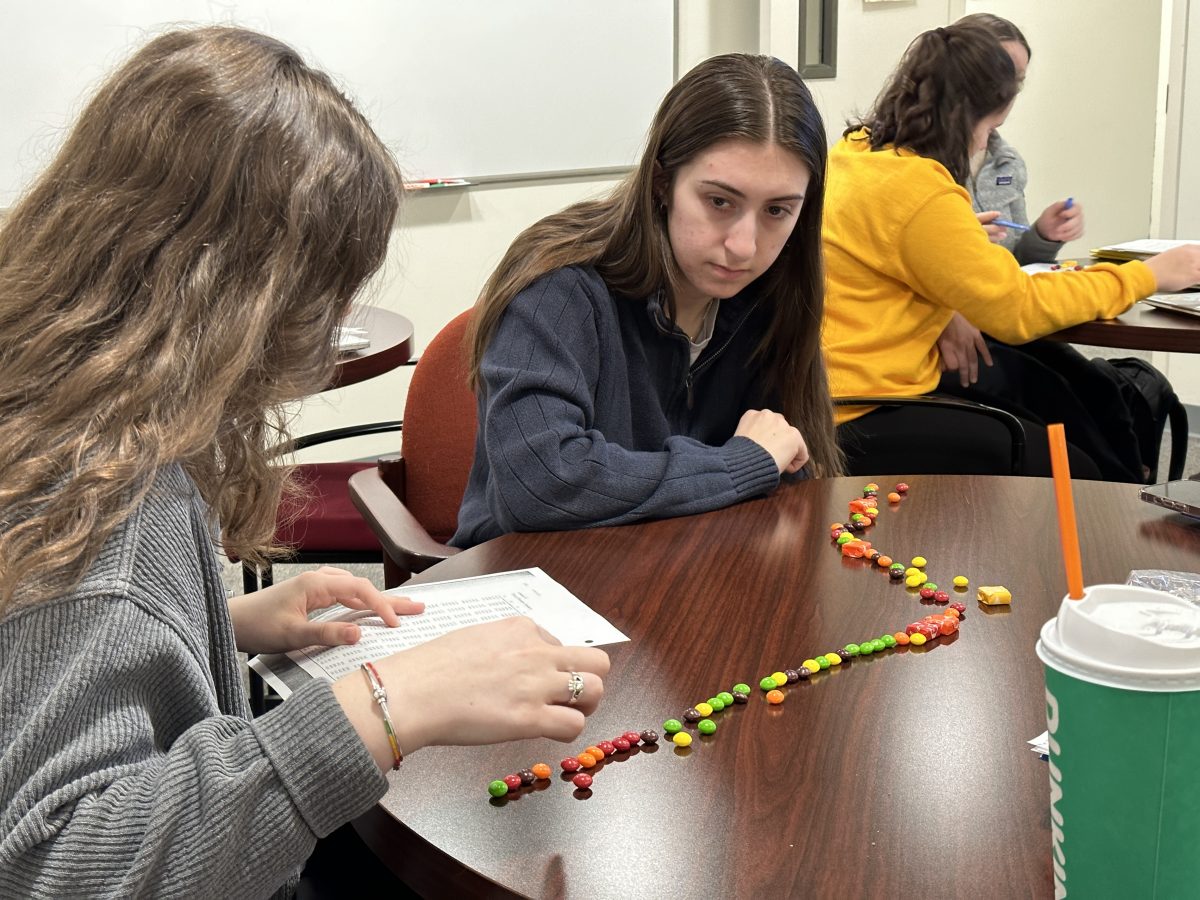
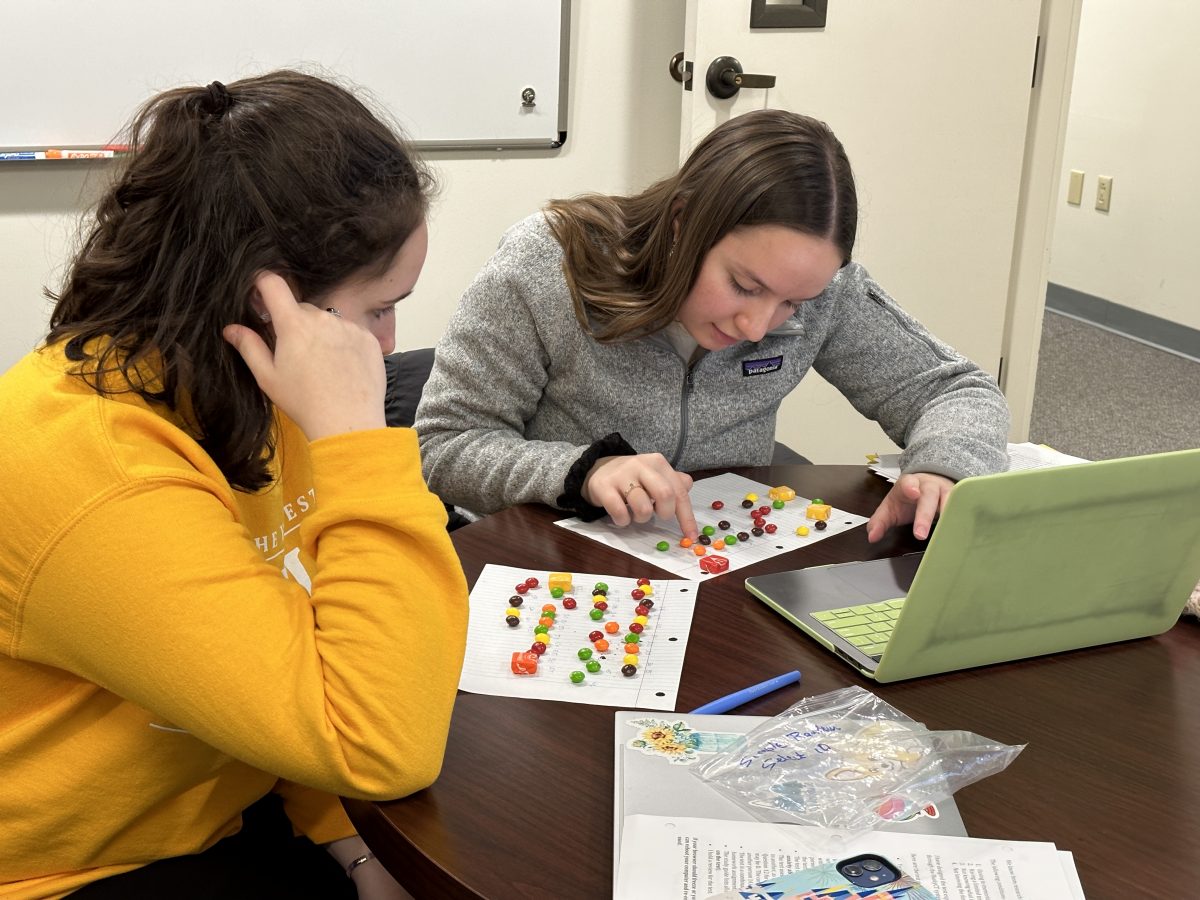
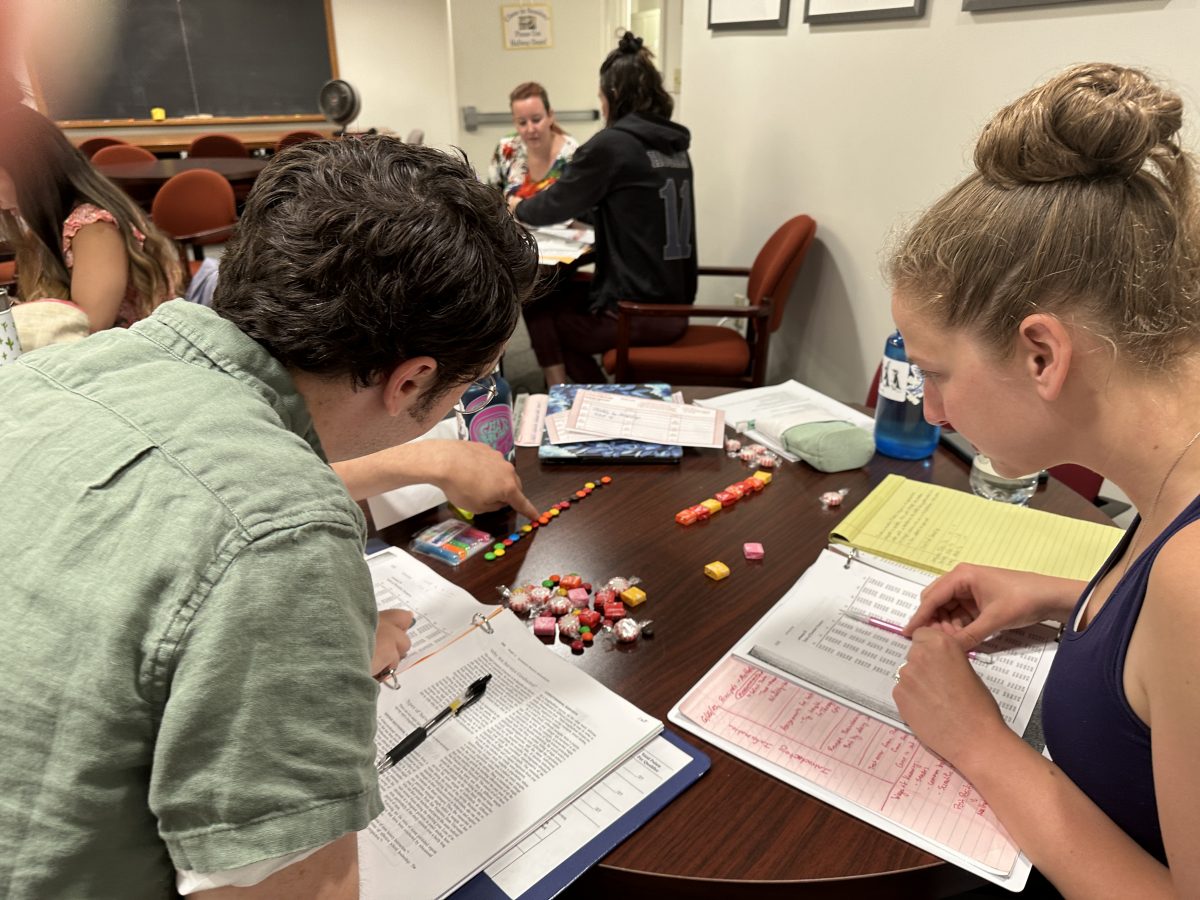
Education Honors Students Sharing Examples of Different Sampling Techniques Using M&Ms.
Classroom Teachers Conducting a Content Analysis of Children’s Picture Books.
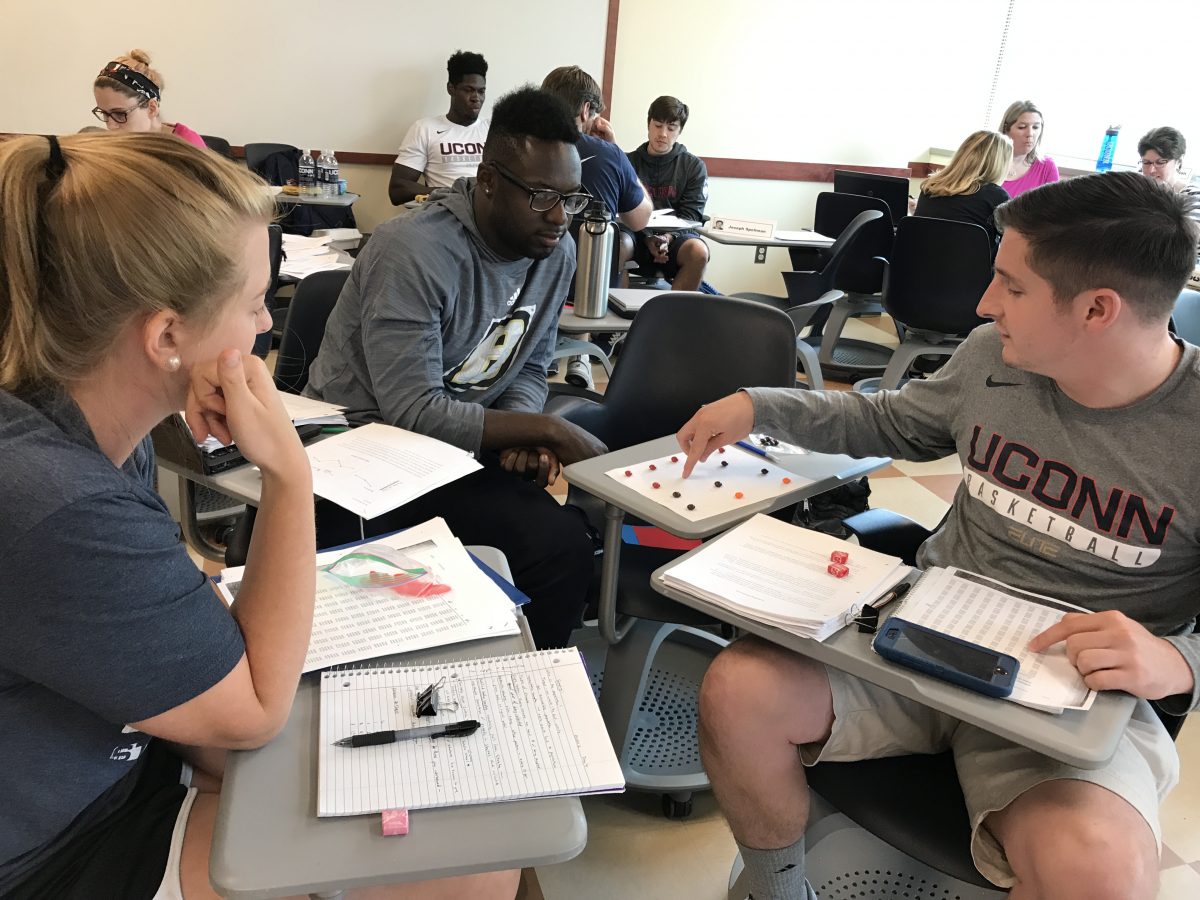
Sport Management Students Discussing Sampling Techniques
UConn Honors Students
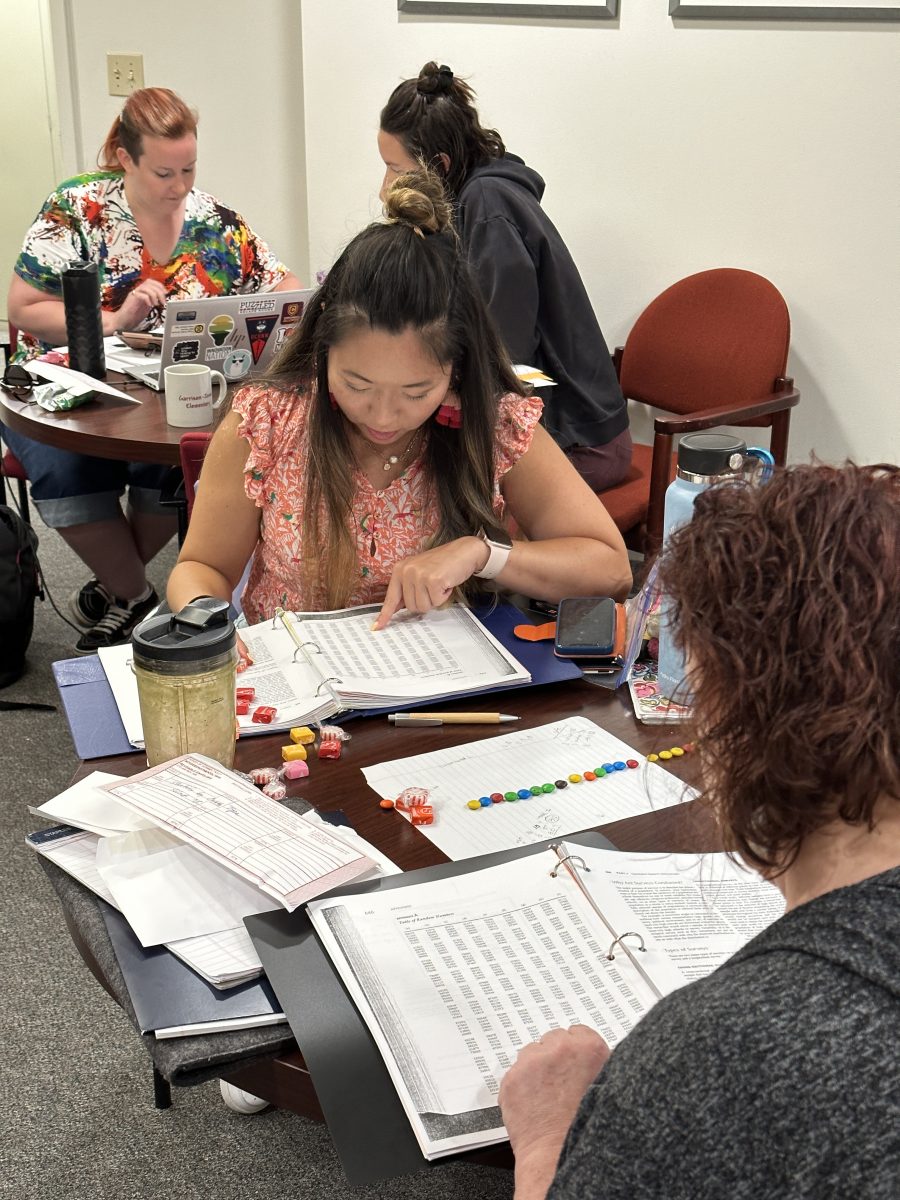
GCT Master’s students using a random number table. |
GCT Master’s students using a random number table.
UConn Honors Students Practicing Content Analysis with Children’s Picture Books
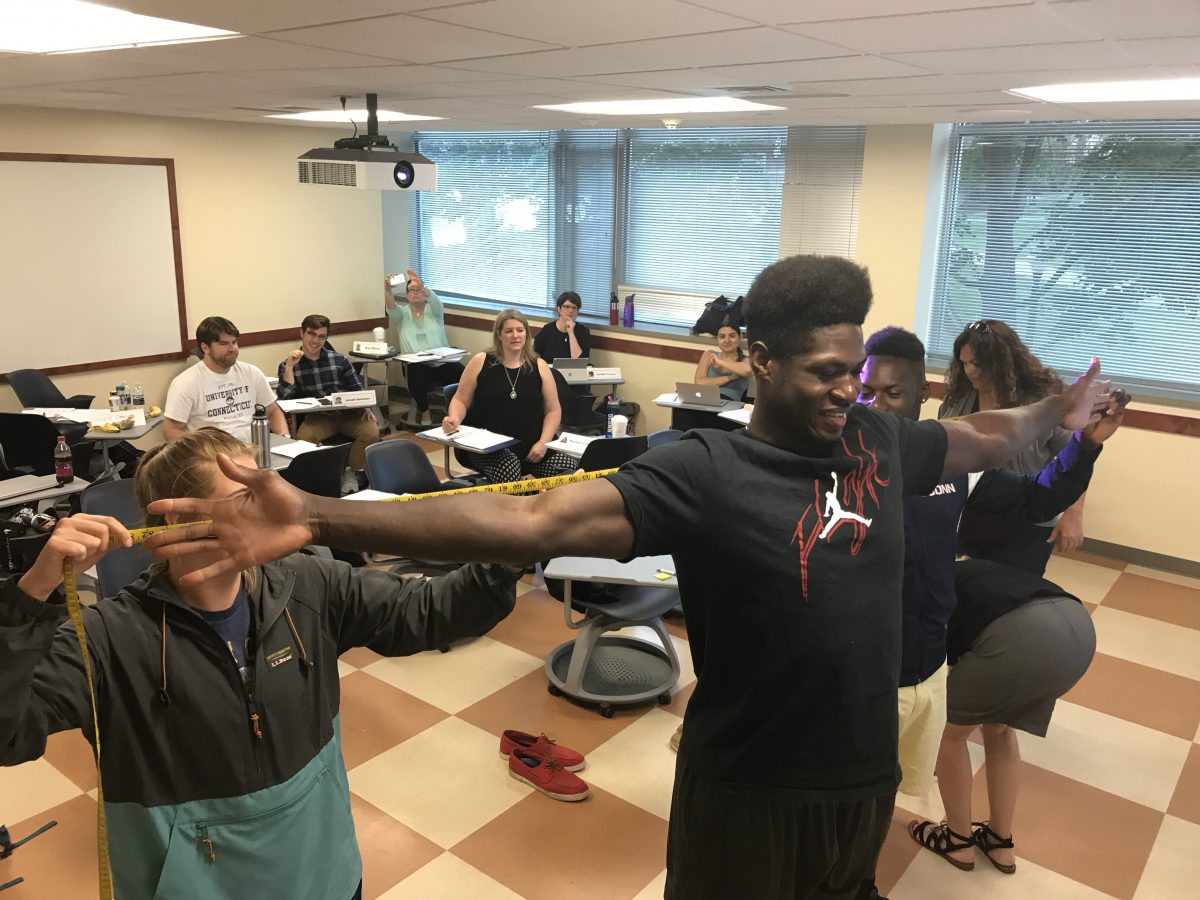
Educators Collecting Arm Span Measurements for a Correlation Analysis.
UConn Honors Students Learning to Use a Random Number Table. Del Siegle, Ph.D. |